Work
Below is a selection of my projects and work. I haven’t updated this since mid-2016, but will sometime soon (August 2017)!
Programs
FrequentFinder
FrequentFinder takes a transit system’s GTFS (Google transit) data and generates a map of services that operate frequently. At its core is a Python program that computes the frequent network and generates a GeoJSON export. This project involves complex problems in graph theory, visualization, and transit system geometry. Planned additions include a script that creates an interactive Mapbox map and a D3 script that creates an SVG.
Uncontested election finder
This is a Python program that can take candidate data files representing any number of Rhode Island elections, aggregate all individual races, determine whether each was contested (including multiple-winner races), and calculate summary statistics.
Maps
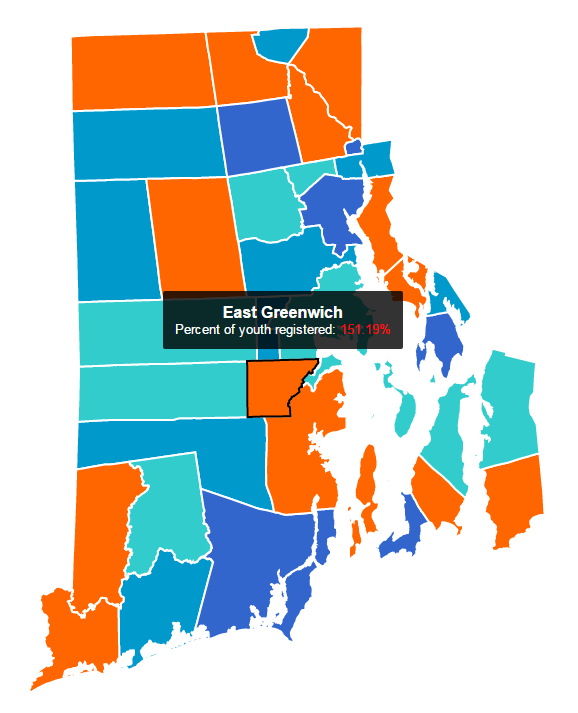
Interactive map of Rhode Island
I created this interactive map of Rhode Island using JavaScript and D3. While currently displaying a specific dataset related to voter registration, it can display any given dataset and was built with reusability in mind.
See the map live
Check out the code on GitHub
Providence base maps
I redesigned ProvPlan/DataSpark’s base maps of Providence. These maps are some of the most widely used maps of the city.
Examples: neighborhoods, schools, historic districts, wards
See the full collection on DataSpark’s website
Data analysis
Subway Showdown: Comparing Local and Express Train Times in NYC
Using Python, this project explores local and express train waiting and travel times in the New York City Subway. Specifically, it tries to answer the question, “If I am waiting at an express station and a local train comes first, is it faster to take that or to chance waiting for the express train and taking that?” (Course project for CS 931 at Brown University.)
See the project website
Check out the code on GitHub
User Engagement on the Brown Daily Herald Facebook Page
Using analysis in Excel, I examined the difference in levels of user engagement for different Facebook post types, specifically whether photo posts have a higher level of user engagement than other post types. (Course project for CS 931 at Brown University. My project was referenced as an example for this assignment in future years.)
The Rise of Senior Staff Writers
Using Python and specifically regular expressions, I examined two years’ worth of newspaper articles to calculate the number of articles written by different types of writers. (Course project for CS 931 at Brown University.)
See the project website
Check out the code on GitHub
Print design
Geology Field Guides (2013, 2014, 2015)
I designed three geology field guide books, each 70-90 pages, for the annual undergraduate spring break field trip of the Department of Geological Sciences at Brown University. The first two were while I was an undergrad; I was hired to do the third.
Check out sample pages from the 2014 book (Not for redistribution)
Brown Urban Studies Newsletter (2014)
I was hired by Brown University’s Urban Studies Program as the Newsletter Editor for 2013-2014. I coordinated and designed a newsletter showcasing the program’s highlights for the year.